terça-feira, 22 de agosto de 2023

PIHOLE-EXPORTER INSTALL

0 comentários

 fonte: https://jarrodstech.net/how-to-pihole-exporter-install-with-prometheus-and-grafana-on-ubuntu-20-04/

Releases: https://github.com/eko/pihole-exporter/releases/


 useradd --system --shell=/usr/sbin/nologin pihole_exporter

sudo mkdir /opt/pihole_exporter

mover o binario para esta pasta criada

sudo chmod -R 500 pihole_exporter/

sudo chown -R pihole_exporter:pihole_exporter pihole_exporter/

sudo nano /lib/systemd/system/pihole_exporter.service

  1. Paste in the following code, replace 10.0.0.4 and xyz with your pihole IP and password.
[Unit]
Description=pihole_exporter

[Service]
ExecStart=/opt/pihole_exporter/pihole_exporter-linux-amd64 -pihole_hostname 10.0.0.4 -pihole_password xyz WorkingDirectory=/opt/pihole_exporter
Restart=always
User=pihole_exporter

[Install]
WantedBy=multi-user.target
  1. Press ctrl + x and type y then enter to save the file
  2. Reload the system daemon systemctl daemon-reload
  3. Run the service service pihole_exporter start
  4. Enable it to run at start up systemctl enable pihole_exporter
  5. Lastly check the status systemctl status pihole_exporter – press q to exit this view


Continue reading →
domingo, 20 de agosto de 2023

Criando interface bridge para o virt-manager com nmcli

0 comentários

 Fonte: Criando interface bridge para o virt-manager com nmcli | SinergicaIT BLOG


Criando a interface bridge

o nmcli Network Manager Comand Line Interface, é p comando que faremos uso para criar e remover as interfaces bridgers

sudo nmcli connection  add type bridge ifname laboratorio1 autoconnect yes

Substitua o eth1 pela sua interface de rede que deseja fazer a bridger

sudo nmcli connection add type bridge-slave  ifname eth1  master  bridge-laboratorio1  autoconnect yes

Agora precisaremos desabilitar a Conexão cabeada 1, que está gerenciando o dispositivo eth1 para em seguida habilitar a nova conexão bridge-laboratorio1

Desabilitando a Conexão cabeada 1

nmcli connection down "Conexão cabeada 1"

Habilitando a bridge-laboratorio

nmcli connection up  "bridge-laboratorio1"
sudo systemctl  restart network-online.target
sudo systemctl  restart network.service

Caso tenha o networkd basta apenas restartá-lo

sudo systemctl  restart networkd.target

Apresentando a bridge ao virsh e virt-manager

Agora registraremos a nova interface para que seja visível durante a escolha de interfaces no virt-manager.

Este comando criará um arquivo xml chamado config-bridge.xml, contendo as informações necessárias para declarar uma interface no virsh e virt-manager.

cat <<EOF> config-bridge.xml
<network>
    <name>laboratorio1</name>
    <forward mode="bridge" />
    <bridge  name="laboratorio1" />
</network>
EOF

Os procedimentos abaixo, consistem em definir, iniciar, programar para auto iniciar durante o boot e também listar as novas interfaces

sudo virsh  net-define config-bridge.xml 
sudo virsh  net-start --network laboratorio1
sudo virsh net-autostart laboratorio1 
sudo virsh net-list --all
Continue reading →
domingo, 23 de julho de 2023

Install Prometheus and node_exporter on Debian 11|10

0 comentários

 Fonte: Install Prometheus and node_exporter on Debian 11|10 | ComputingForGeeks


How To Install Prometheus on Debian 11| Debian 10 Linux?. Prometheus is a free and open source monitoring system that enables you to collect time-series data metrics from any target systems. Its web interface enables you to perform powerful queries, visualize collected data, and to configure alerts.

In this guide, we will cover the installation of Prometheus and node_exporter on Debian 11 / Debian 10. Since this is a binary installation method, there is no required dependency to continue with the setup.

Step 1: Create Prometheus system user / group

We’ll create a dedicated Prometheus system user and group. The  -r or –system option is used for this purpose.

sudo groupadd --system prometheus
sudo useradd -s /sbin/nologin --system -g prometheus prometheus

This creates a system user which doesn’t need /bin/bash shell, that’s why we used -s /sbin/nologin.

Step 2: Create configuration and data directories

Prometheus needs directories to store data and configuration files. Create all required directories using the commands below.

sudo mkdir /var/lib/prometheus
for i in rules rules.d files_sd; do sudo mkdir -p /etc/prometheus/${i}; done

Step 3: Download and Install Prometheus onDebian 11 / Debian 10

Let’s download the latest release of Prometheus archive and extract it to get binary files. You can check releases from Prometheus releases Github page.

sudo apt-get update
sudo apt-get -y install wget curl
mkdir -p /tmp/prometheus && cd /tmp/prometheus
curl -s https://api.github.com/repos/prometheus/prometheus/releases/latest|grep browser_download_url|grep linux-amd64|cut -d '"' -f 4|wget -qi -

Extract the file.

tar xvf prometheus*.tar.gz
cd prometheus*/

Move the prometheus binary files to /usr/local/bin/

Since /usr/local/bin/ is in your PATH, let’s copy binary files to it.

sudo mv prometheus promtool /usr/local/bin/

Move prometheus configuration template to /etc directory.

sudo mv prometheus.yml  /etc/prometheus/prometheus.yml

Also move consoles and console_libraries to /etc/prometheus directory:

sudo mv consoles/ console_libraries/ /etc/prometheus/
cd ~/
rm -rf /tmp/prometheus

Step 4: Create/Edit a Prometheus configuration file.

Prometheus configuration file will be located under /etc/prometheus/prometheus.yml.

cat /etc/prometheus/prometheus.yml

The default configuration file looks similar to below.

# my global config
global:
  scrape_interval:     15s # Set the scrape interval to every 15 seconds. Default is every 1 minute.
  evaluation_interval: 15s # Evaluate rules every 15 seconds. The default is every 1 minute.
  # scrape_timeout is set to the global default (10s).

# Alertmanager configuration
alerting:
  alertmanagers:
  - static_configs:
    - targets:
      # - alertmanager:9093

# Load rules once and periodically evaluate them according to the global 'evaluation_interval'.
rule_files:
  # - "first_rules.yml"
  # - "second_rules.yml"

# A scrape configuration containing exactly one endpoint to scrape:
# Here it's Prometheus itself.
scrape_configs:
  # The job name is added as a label `job=<job_name>` to any timeseries scraped from this config.
  - job_name: 'prometheus'

    # metrics_path defaults to '/metrics'
    # scheme defaults to 'http'.

    static_configs:
    - targets: ['localhost:9090']

Step 5: Create a Prometheus systemd Service unit file

To be able to manage Prometheus service with systemd, you need to explicitly define this unit file.

sudo tee /etc/systemd/system/prometheus.service<<EOF
[Unit]
Description=Prometheus
Documentation=https://prometheus.io/docs/introduction/overview/
Wants=network-online.target
After=network-online.target

[Service]
Type=simple
User=prometheus
Group=prometheus
ExecReload=/bin/kill -HUP $MAINPID
ExecStart=/usr/local/bin/prometheus \
  --config.file=/etc/prometheus/prometheus.yml \
  --storage.tsdb.path=/var/lib/prometheus \
  --web.console.templates=/etc/prometheus/consoles \
  --web.console.libraries=/etc/prometheus/console_libraries \
  --web.listen-address=0.0.0.0:9090 \
  --web.external-url=

SyslogIdentifier=prometheus
Restart=always

[Install]
WantedBy=multi-user.target
EOF

Change directory permissions.

Change the ownership of these directories to Prometheus user and group.

for i in rules rules.d files_sd; do sudo chown -R prometheus:prometheus /etc/prometheus/${i}; done
for i in rules rules.d files_sd; do sudo chmod -R 775 /etc/prometheus/${i}; done
sudo chown -R prometheus:prometheus /var/lib/prometheus/

Reload systemd daemon and start the service.

sudo systemctl daemon-reload
sudo systemctl start prometheus
sudo systemctl enable prometheus

Confirm that the service is running.

$ systemctl status prometheus.service 
* prometheus.service - Prometheus
     Loaded: loaded (/etc/systemd/system/prometheus.service; enabled; vendor preset: enabled)
     Active: active (running) since Mon 2023-05-22 23:42:43 EAT; 19s ago
       Docs: https://prometheus.io/docs/introduction/overview/
   Main PID: 5790 (prometheus)
      Tasks: 6 (limit: 9303)
     Memory: 16.5M
        CPU: 45ms
     CGroup: /system.slice/prometheus.service
             `-5790 /usr/local/bin/prometheus --config.file=/etc/prometheus/prometheus.yml --storage.tsdb.path=/var/lib/prometheus --web.console.>

May 22 23:42:43 grafana prometheus[5790]: ts=2023-05-22T20:42:43.219Z caller=tls_config.go:232 level=info component=web msg="Listening on" addres>
May 22 23:42:43 grafana prometheus[5790]: ts=2023-05-22T20:42:43.219Z caller=tls_config.go:235 level=info component=web msg="TLS is disabled." ht>
May 22 23:42:43 grafana prometheus[5790]: ts=2023-05-22T20:42:43.220Z caller=head.go:748 level=info component=tsdb msg="WAL segment loaded" segme>
May 22 23:42:43 grafana prometheus[5790]: ts=2023-05-22T20:42:43.220Z caller=head.go:785 level=info component=tsdb msg="WAL replay completed" che>
May 22 23:42:43 grafana prometheus[5790]: ts=2023-05-22T20:42:43.221Z caller=main.go:1037 level=info fs_type=EXT4_SUPER_MAGIC
May 22 23:42:43 grafana prometheus[5790]: ts=2023-05-22T20:42:43.221Z caller=main.go:1040 level=info msg="TSDB started"
May 22 23:42:43 grafana prometheus[5790]: ts=2023-05-22T20:42:43.221Z caller=main.go:1220 level=info msg="Loading configuration file" filename=/e>
May 22 23:42:43 grafana prometheus[5790]: ts=2023-05-22T20:42:43.221Z caller=main.go:1257 level=info msg="Completed loading of configuration file>
May 22 23:42:43 grafana prometheus[5790]: ts=2023-05-22T20:42:43.222Z caller=main.go:1001 level=info msg="Server is ready to receive web requests>
May 22 23:42:43 grafana prometheus[5790]: ts=2023-05-22T20:42:43.222Z caller=manager.go:995 level=info component="rule manager" msg="Starting rul>
root@grafana:~# 

Access Prometheus web interface on URL http://[ip_hostname]:9090.
Step 6: Install node_exporter onDebian 11 / Debian 10

Download node_exporter archive.

curl -s https://api.github.com/repos/prometheus/node_exporter/releases/latest| grep browser_download_url|grep linux-amd64|cut -d '"' -f 4|wget -qi -

Extract downloaded file and move the binary file to /usr/local/bin.

tar -xvf node_exporter*.tar.gz
cd  node_exporter*/
sudo cp node_exporter /usr/local/bin
cd

Confirm installation.

$ node_exporter --version
node_exporter, version 1.5.0 (branch: HEAD, revision: 1b48970ffcf5630534fb00bb0687d73c66d1c959)
  build user:       root@6e7732a7b81b
  build date:       20221129-18:59:09
  go version:       go1.19.3
  platform:         linux/amd64

Create node_exporter service.

sudo tee /etc/systemd/system/node_exporter.service <<EOF
[Unit]
Description=Node Exporter
Wants=network-online.target
After=network-online.target

[Service]
User=prometheus
ExecStart=/usr/local/bin/node_exporter

[Install]
WantedBy=default.target
EOF

Reload systemd and start the service.

sudo systemctl daemon-reload
sudo systemctl start node_exporter
sudo systemctl enable node_exporter

Confirm status:

$ systemctl status node_exporter.service
* node_exporter.service - Node Exporter
     Loaded: loaded (/etc/systemd/system/node_exporter.service; enabled; vendor preset: enabled)
     Active: active (running) since Mon 2023-05-22 23:45:06 EAT; 6s ago
   Main PID: 5872 (node_exporter)
      Tasks: 5 (limit: 9303)
     Memory: 2.2M
        CPU: 5ms
     CGroup: /system.slice/node_exporter.service
             `-5872 /usr/local/bin/node_exporter

May 22 23:45:06 grafana node_exporter[5872]: ts=2023-05-22T20:45:06.996Z caller=node_exporter.go:117 level=info collector=thermal_zone
May 22 23:45:06 grafana node_exporter[5872]: ts=2023-05-22T20:45:06.996Z caller=node_exporter.go:117 level=info collector=time
May 22 23:45:06 grafana node_exporter[5872]: ts=2023-05-22T20:45:06.996Z caller=node_exporter.go:117 level=info collector=timex
May 22 23:45:06 grafana node_exporter[5872]: ts=2023-05-22T20:45:06.996Z caller=node_exporter.go:117 level=info collector=udp_queues
May 22 23:45:06 grafana node_exporter[5872]: ts=2023-05-22T20:45:06.996Z caller=node_exporter.go:117 level=info collector=uname
May 22 23:45:06 grafana node_exporter[5872]: ts=2023-05-22T20:45:06.996Z caller=node_exporter.go:117 level=info collector=vmstat
May 22 23:45:06 grafana node_exporter[5872]: ts=2023-05-22T20:45:06.996Z caller=node_exporter.go:117 level=info collector=xfs
May 22 23:45:06 grafana node_exporter[5872]: ts=2023-05-22T20:45:06.996Z caller=node_exporter.go:117 level=info collector=zfs
May 22 23:45:06 grafana node_exporter[5872]: ts=2023-05-22T20:45:06.996Z caller=tls_config.go:232 level=info msg="Listening on" address=[::]:9100
May 22 23:45:06 grafana node_exporter[5872]: ts=2023-05-22T20:45:06.996Z caller=tls_config.go:235 level=info msg="TLS is disabled." http2=false a>

Once we confirm the service to be running, let’s add the node_exporter to the Prometheus server.

sudo vim /etc/prometheus/prometheus.yml

Add new job under scrape_config section.

scrape_configs:
  # The job name is added as a label `job=<job_name>` to any timeseries scraped from this config.
  - job_name: "prometheus"
    static_configs:
      - targets: ["localhost:9090"]
  - job_name: 'node_exporter'
    static_configs:
      - targets: ['localhost:9100']

Restart Prometheus:

sudo systemctl restart prometheus

You now have Prometheus installed onDebian 11 / Debian 10 Linux system. Check our Prometheus monitoring guides.

Continue reading →
quinta-feira, 22 de junho de 2023

How to Enable KVM Kernel Module on Raspberry Pi OS?

0 comentários

Fontes:

How to Enable KVM Kernel Module on Raspberry Pi OS? (linuxhint.com)

How to configure network bridge for KVM virtual machines in Linux (bobcares.com)


The KVM, or Kernel Virtual Machine, is the virtualization solution for Linux. It is a Linux kernel module that allows the Linux kernel to act as a hypervisor program like VMware ESXi or VSphere.

Earlier it was impossible to get KVM running on the Raspberry Pi using the Raspberry Pi OS (also known as Raspbian). This is because KVM only works on a 64-bit operating system. Raspberry Pi OS was a 32-bit operating system. Another reason was that Raspberry Pi 3 and earlier models had only 1 GB of memory, and this is insufficient to run KVM. Docker was a better solution for devices with 1 GB of memory.

At the time of this writing, it is possible to run KVM on the Raspberry Pi using the Raspberry Pi OS. Because Raspberry Pi OS officially ships with a 64-bit kernel, and the Raspberry Pi 4 has an 8 GB model (it has 8 GB of memory). Sadly, the 64-bit Raspberry Pi OS kernel is not enabled by default. You have to enable it manually.

In this article, I am going to show you how to enable the 64-bit Raspberry Pi OS kernel and install KVM on the Raspberry Pi OS.

So, let’s get started!

Things You Will Need:

To follow this article, you will need the following things to set up your Raspberry Pi 4 in headless mode:

  1. Raspberry Pi 4 (8 GB version recommended, 4 GB version will also work) single-board computer
  2. USB Type-C power adapter
  3. 32 GB or higher capacity MicroSD card with Raspberry Pi OS (with the desktop environment) flashed
  4. Network connectivity on the Raspberry Pi 4
  5. Laptop or desktop computer for VNC remote desktop access to the Raspberry Pi 4

If you don’t want to set up your Raspberry Pi 4 in headless mode, you will also need:

  1. Monitor
  2. HDMI or micro-HDMI cable
  3. Keyboard
  4. Mouse

If you need any assistance on flashing the Raspberry Pi OS image on the MicroSD card, check my article How to Install and Use Raspberry Pi Imager.

If you’re a Raspberry Pi beginner and you need any assistance on installing Raspberry Pi OS on your Raspberry Pi 4, check my article How to Install Raspberry Pi OS on Raspberry Pi 4.

Also, if you need any assistance on the headless setup of Raspberry Pi 4, check my article How to Install and Configure Raspberry Pi OS on Raspberry Pi 4 Without External Monitor.

Upgrading Raspberry Pi OS

Before enabling the 64-bit kernel and installing KVM on the Raspberry Pi OS, it’s a good idea to upgrade all the existing packages of your Raspberry Pi OS. This will update the kernel if there is any new version of the kernel available or fix known bugs (if there are any).

Let’s check the kernel version before upgrading all the existing packages of Raspberry Pi OS.

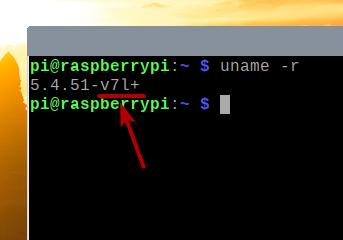
uname -r

As you can see, I am running the kernel version 5.4.51 compiled for the ARMv7l architecture.
Now, let’s upgrade all the existing packages of Raspberry Pi OS.

First, update all the APT package repository cache with the following command:
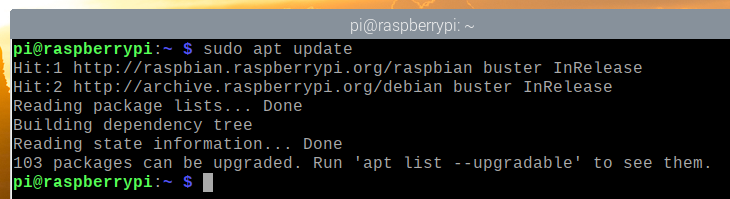
sudo apt update

To upgrade all the existing packages (including the kernel), run the following command:

sudo apt full-upgrade

To confirm the installation, press Y and then press <Enter>.
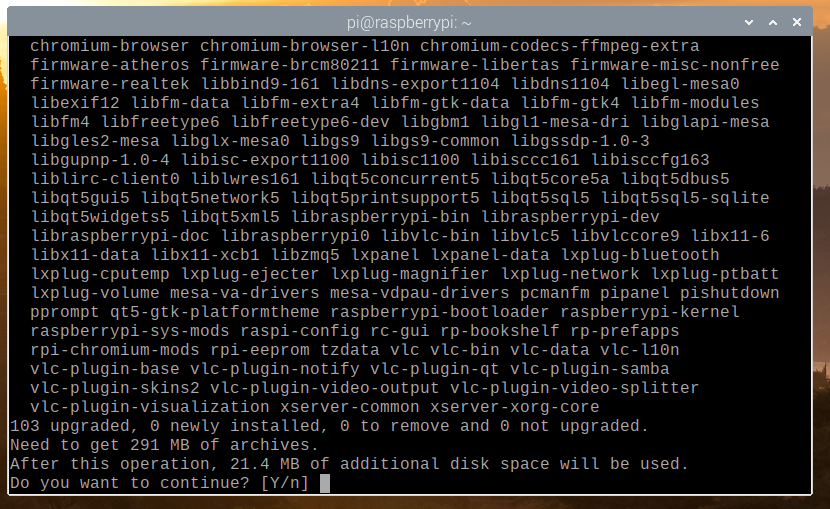
The APT package manager will download all the required packages from the internet but it will take a while to complete.
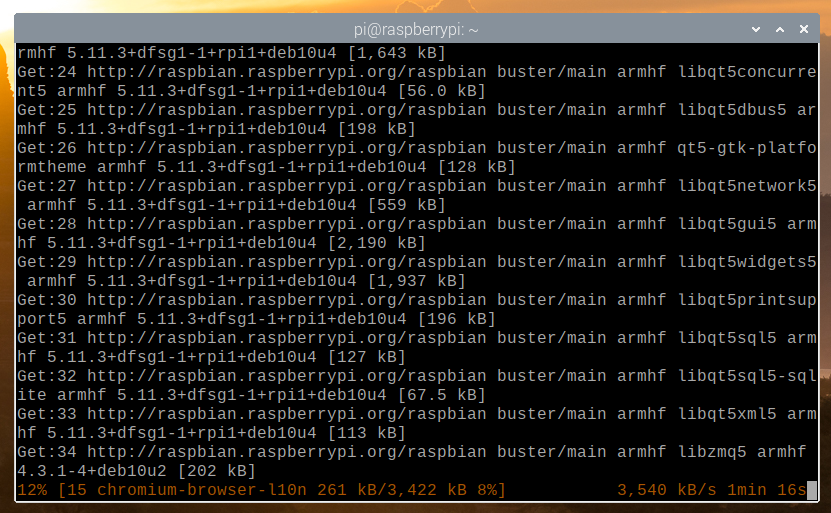
Once the download is complete, it will automatically install them. It will take a while to complete.
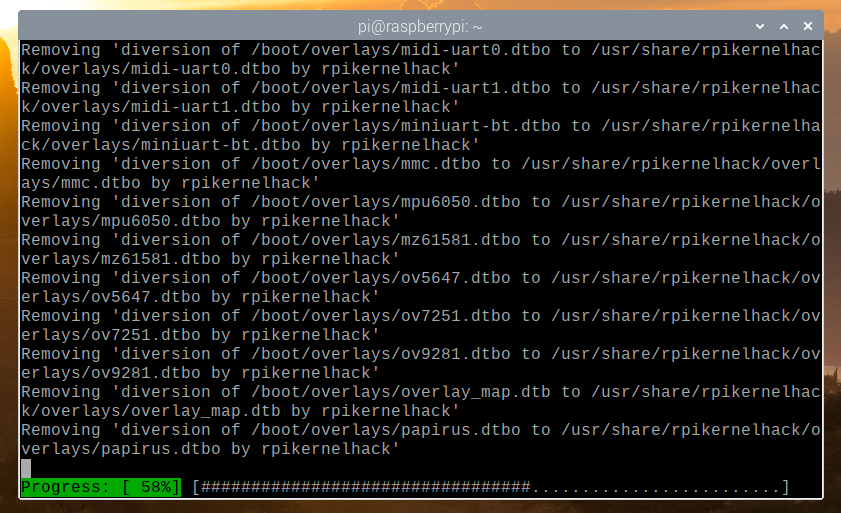
At this point, all the updates should be installed.

For the changes to take effect, reboot your Raspberry Pi 4 with the following command:
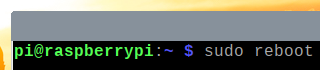
sudo reboot

Once your Raspberry Pi 4 starts, you may see that the kernel version has been updated.
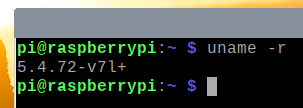
Enabling 64-bit Kernel on Raspberry Pi OS

On the latest release of Raspberry Pi OS, the 64-bit kernel is distributed along with the 32-bit kernel by default. The 64-bit kernel is still in beta. So, it is not set as the default kernel on the Raspberry Pi OS.

To use the 64-bit kernel on the Raspberry Pi OS, open the /boot/config.txt file with the nano text editor as follows:

nano /boot/config.txt

Add arm_64bit=1 at the end of the /boot/config.txt file as marked in the screenshot below.

Once you’re done, press <Ctrl> + X followed by Y and <Enter> to save the /boot/config.txt file.

For the changes to take effect, restart your Raspberry Pi 4 with the following command:

sudo reboot

Once your Raspberry Pi 4 starts, check the kernel version with the following command:

uname -r

You should see v8+ at the end of the kernel version, as you can see in the marked section of the screenshot below. It means we are using the 64-bit kernel.
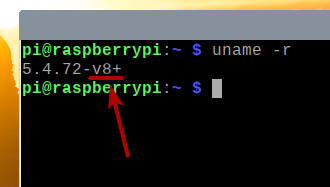
The file /dev/kvm should also be available, as you can see in the screenshot below.

sudo ls -lh /dev/kvm

Installing KVM/QEMU:

Once the 64-bit kernel is enabled, you can install KVM, QEMU, and Virtual Machine Manager with the following command:

sudo apt install virt-manager libvirt0 qemu-system

To confirm the installation, press Y and then press <Enter>.
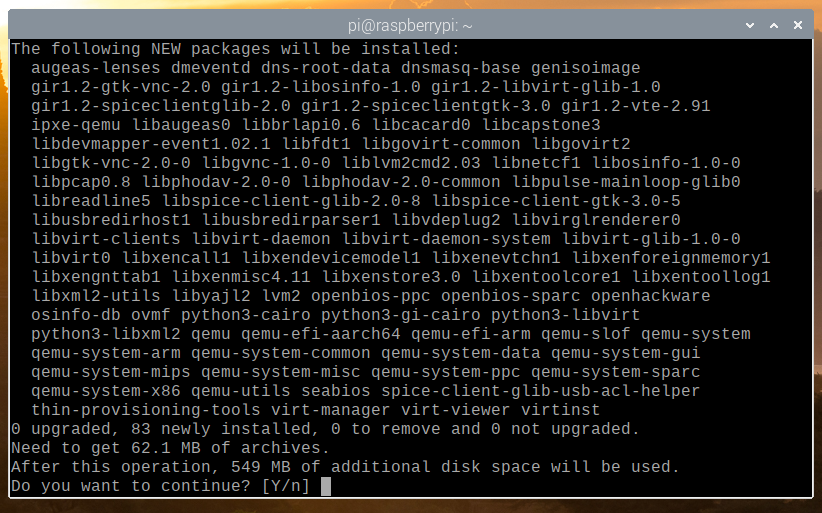
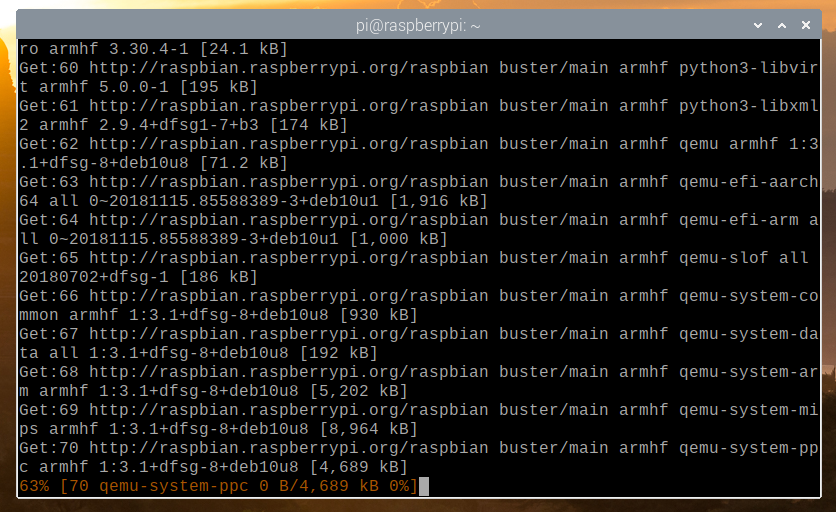
The APT package manager will download all the required packages from the internet. It may take a while to complete.
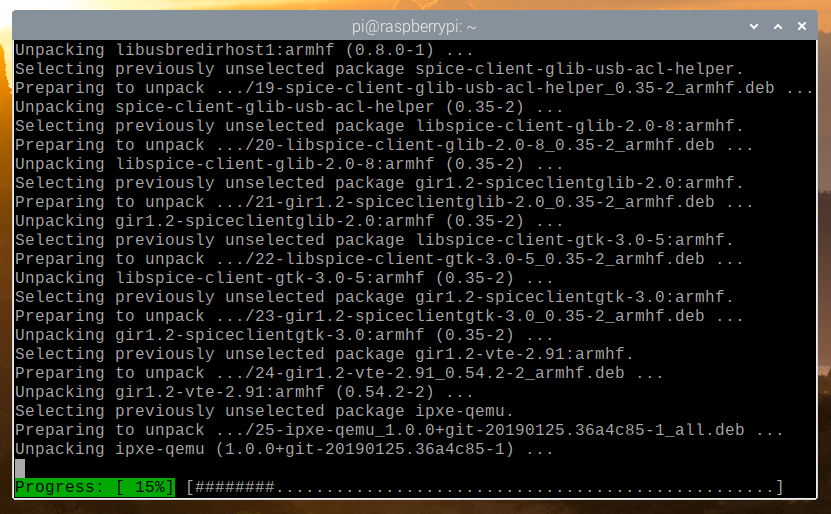
Once the packages are downloaded, the APT package manager will install them. It may take a while to complete.
At this point, all the required packages should be installed.
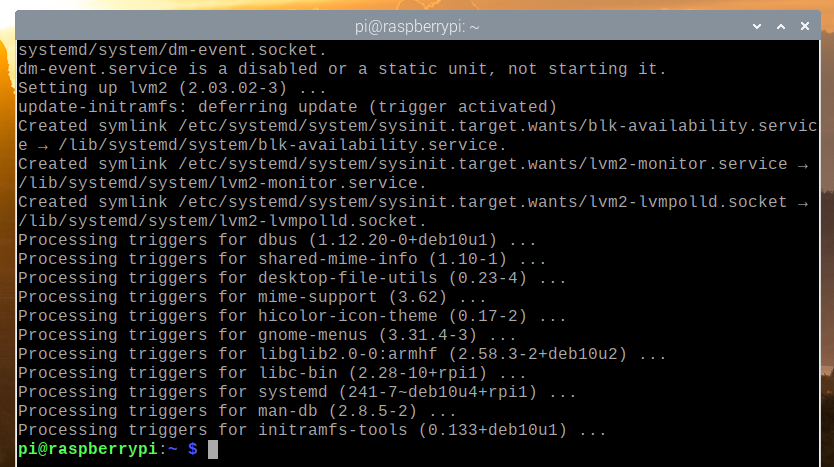
Now, add the pi user to the libvirt-qemu group with the following command:

sudo usermod -aG libvirt-qemu $(whoami)

For the changes to take effect, reboot your Raspberry Pi 4 with the following command:
sudo reboot

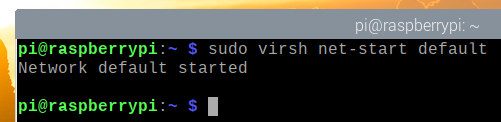
Once your Raspberry Pi 4 boots, start the default KVM network with the following command:

sudo virsh net-start default

To make sure that the default KVM network starts automatically on boot, run the following command:

sudo virsh net-autostart default


To configure the bridging interface, run the below command.

$ sudo vim /etc/network/interfaces
auto br1
iface br1 inet static
#ip na mesma rede para ser fixo e servir de bridge
address 192.xxx.xx.xx
network 192.xxx.x.x
netmask 255.255.255.0
broadcast 192.xxx.x.xxx
gateway 192.xxx.x.x
dns-nameservers 192.xxx.x.x
bridge_ports eth0
bridge_stp off

Then disable all the lines on eth0 interface section so that it looks something like below:

auto eth0
iface eth0 inet manual

Finally, restart the networking service.

$ sudo systemctl restart networking.service


qemu-img resize haos_generic-aarch64-10.3.qcow2.old +20G

Continue reading →